Getting Started | 
In this tutorial, you will create a simple Workflow to get familiar with Data Analytics System.
Specifically, you will:
- Upload a new Dataset
- Create a Workflow that reads the Dataset and applies the K-means algorithm
- Execute the Workflow
- Visualize the obtained results
1. Login
First, log in using the credentials provided by your system administrator.
2. Dataset Upload
Proceed with uploading the Dataset.
In Data Analytics System, a Dataset refers to a specific location within a Datasource (e.g., "bucket/prefix" in the case of a MinIO Object Store).
2.1 Download the Dataset
Download the Iris dataset in CSV format to your computer from the following URL:
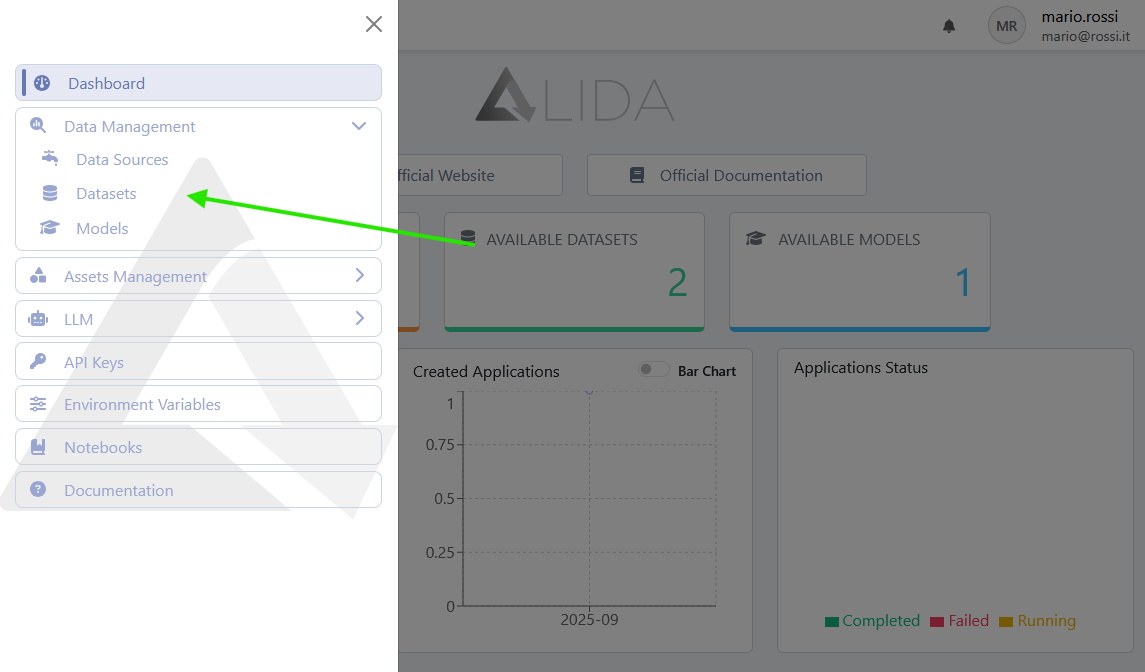
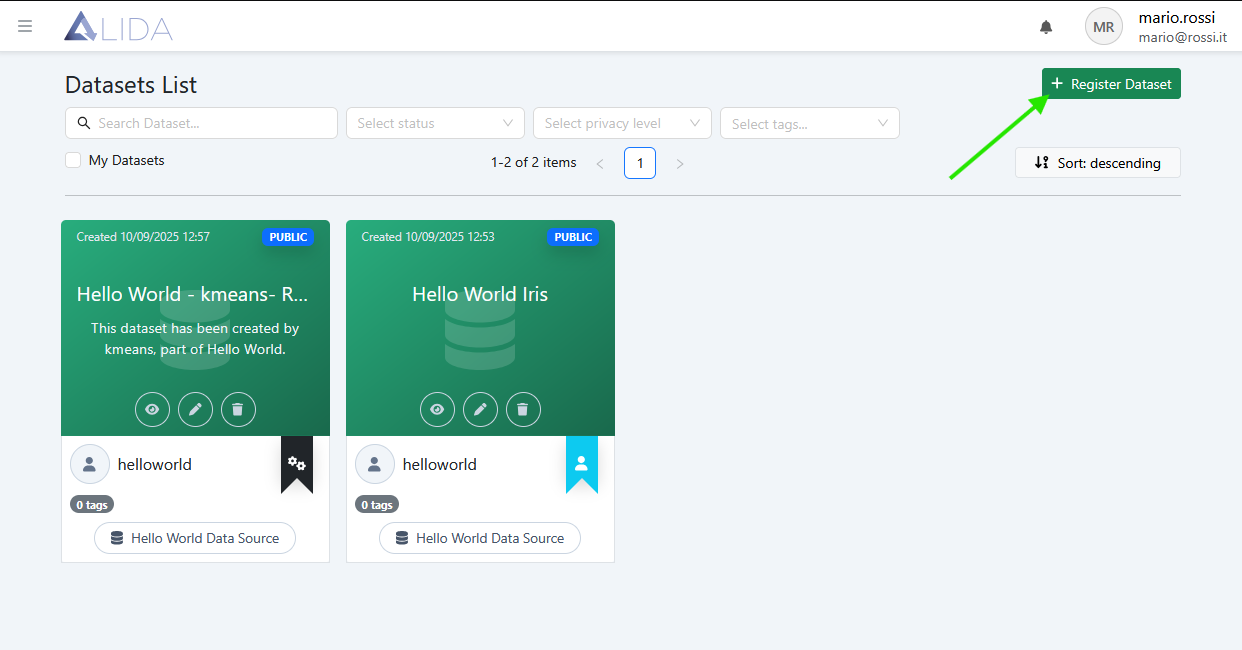
2.2 Access the Dataset Registration Page
Follow the figures below:
![]()
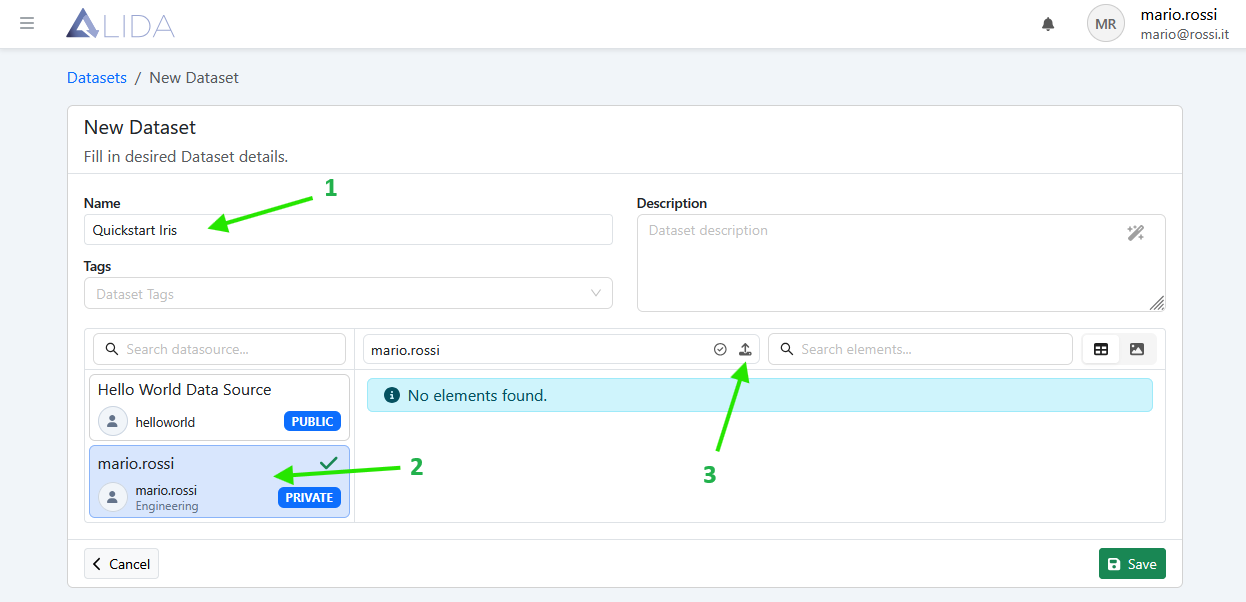
2.3 Fill in the Registration Form
Complete the form as shown below (see also figures):
- Name:
Quickstart Iris - Select the Datasource where you want to upload the dataset:
<your username> - Open the Dataset upload panel by clicking the Upload Dataset button

Dataset registration form - In the opened panel, enter the name of the new folder to be created:
Quickstart Iris
(the uploaded file will be saved inside this folder). - Upload the Iris dataset downloaded in step 2.1 by clicking the “Drop files or folders here” area.
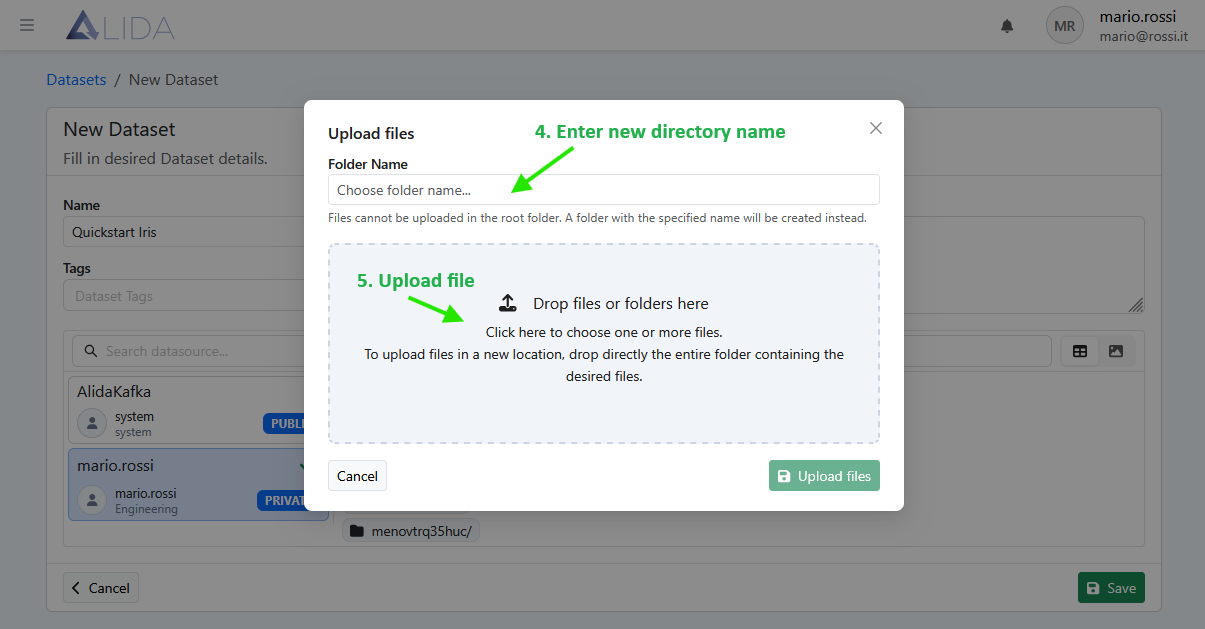
Dataset upload panel 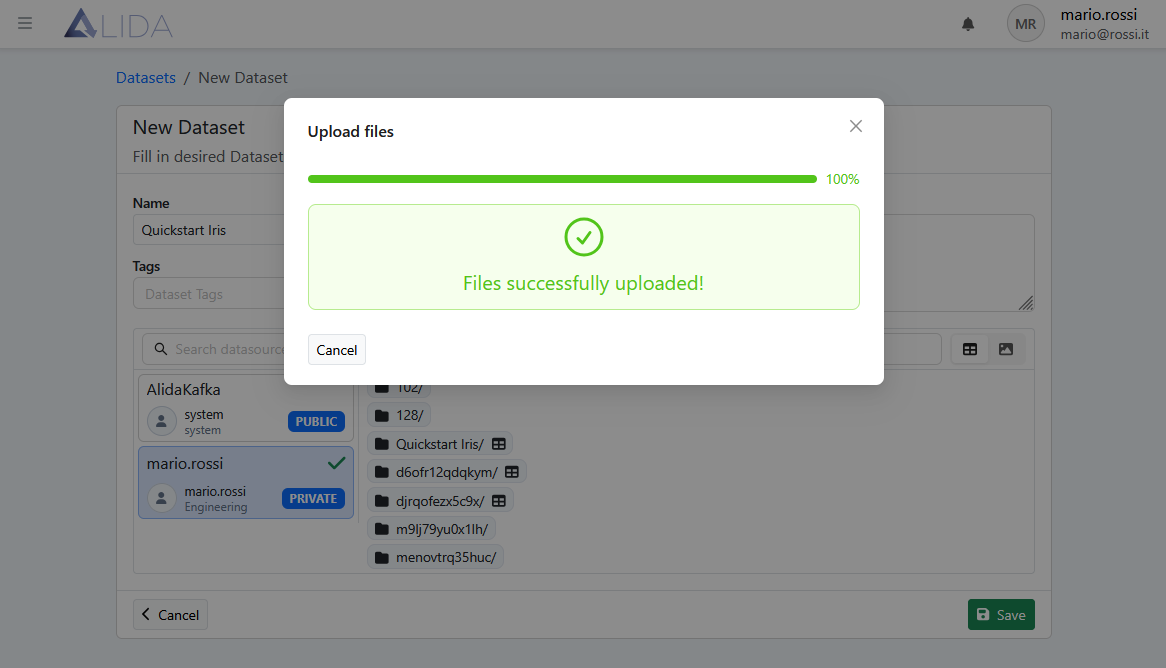
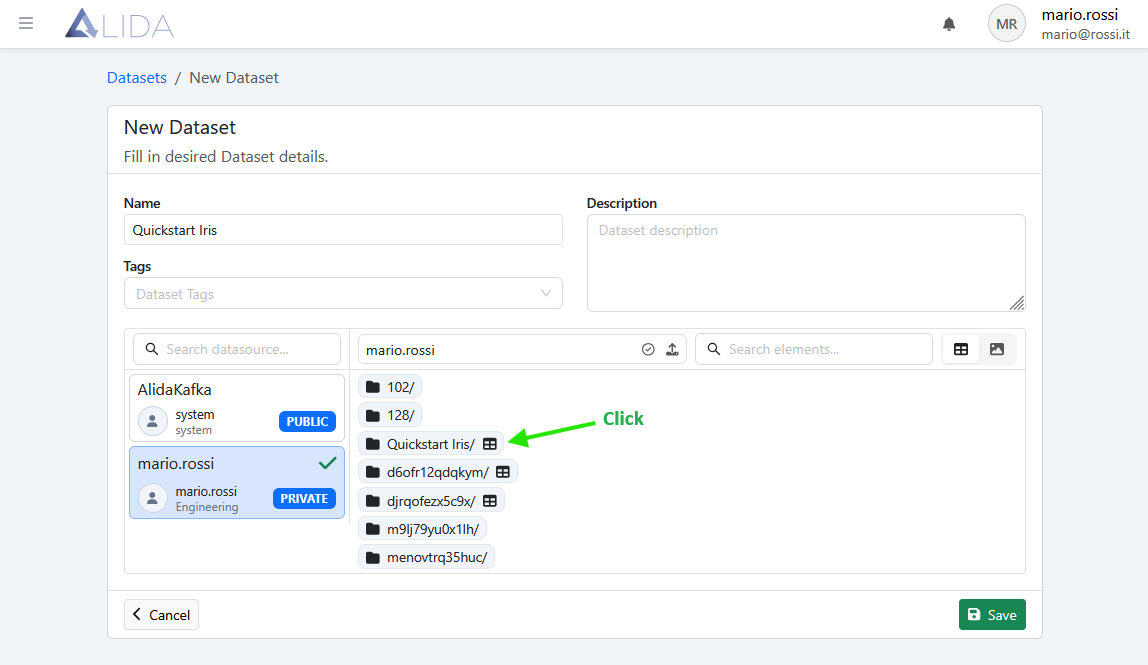
- Click on the newly created directory.
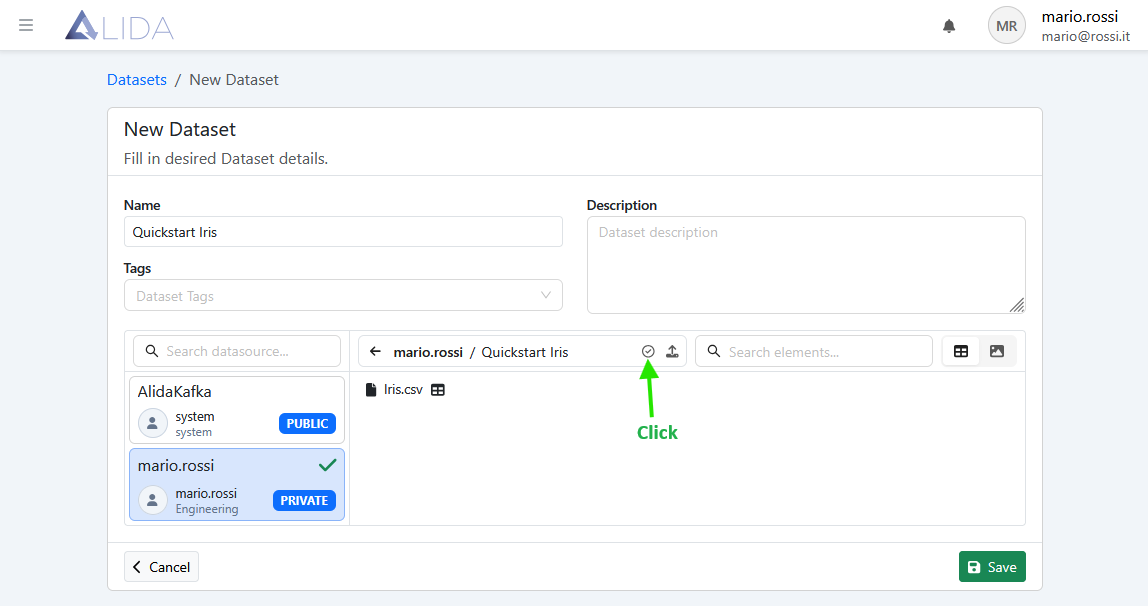
- Select the dataset path by clicking the Select Dataset Path icon
 as shown below:
 Once selected, the schema of the Dataset will be displayed at the bottom of the same page.
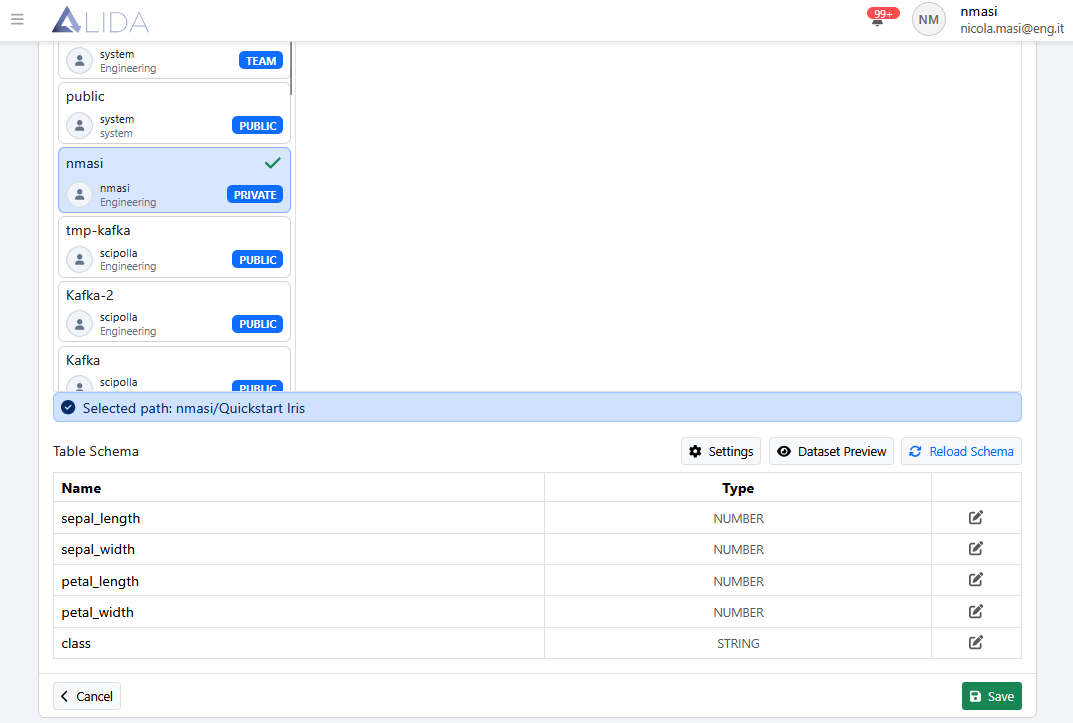
- Click Save.
The detail page for the newly created Dataset will appear:
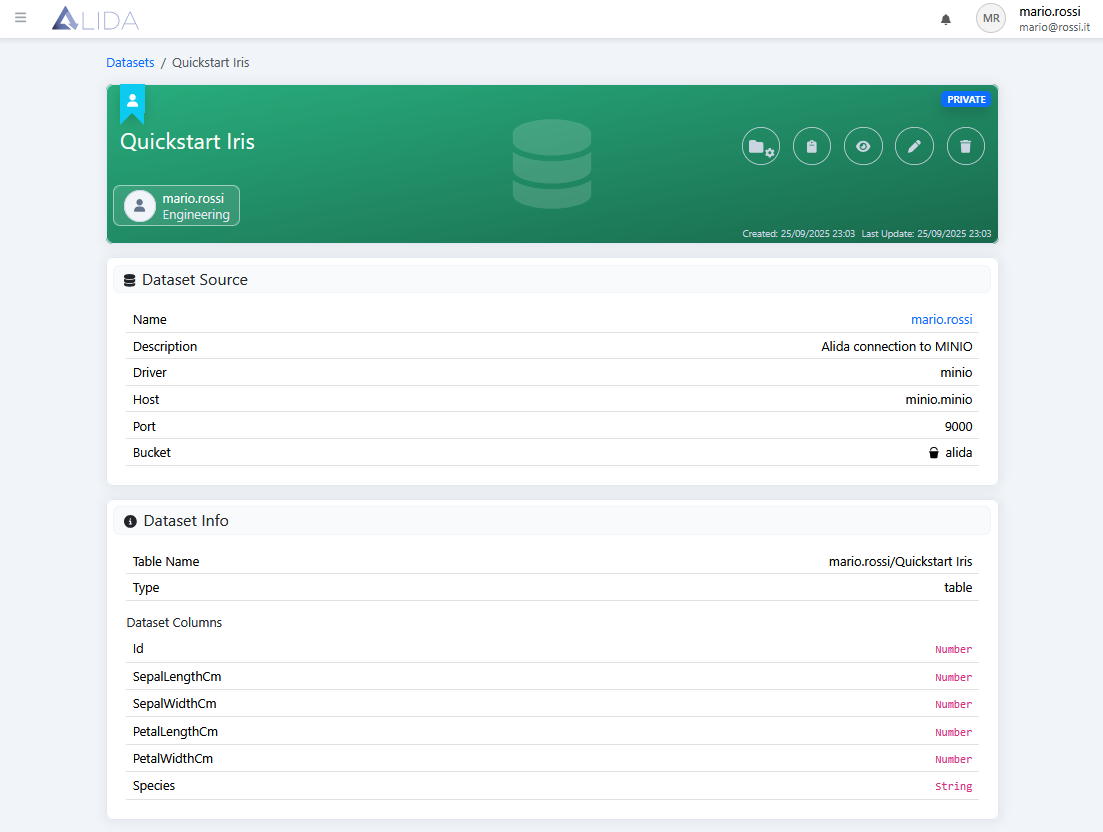
3. Workflow Creation
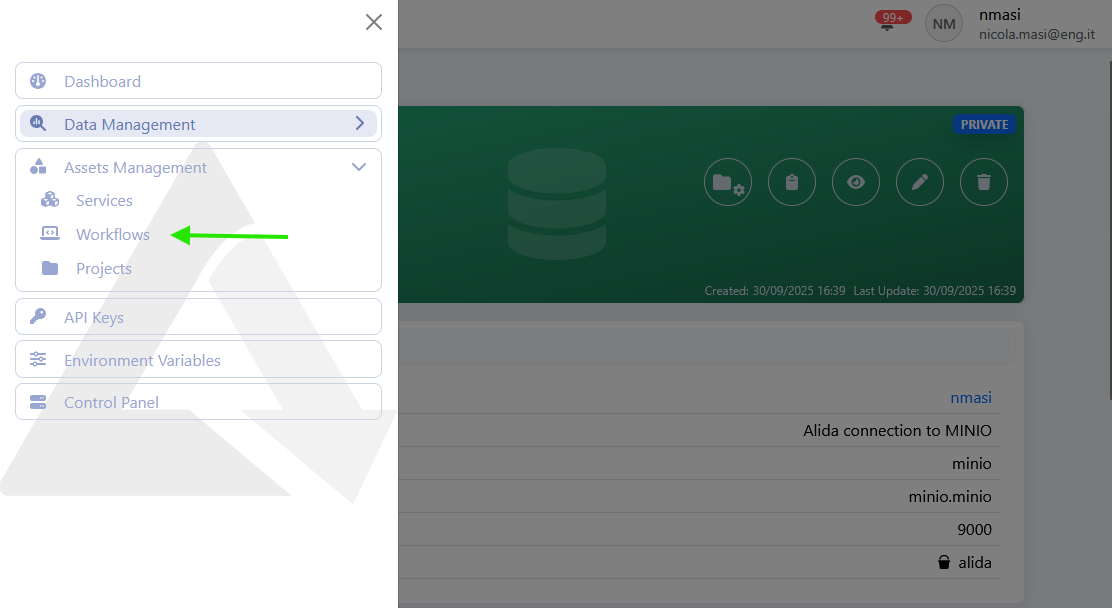
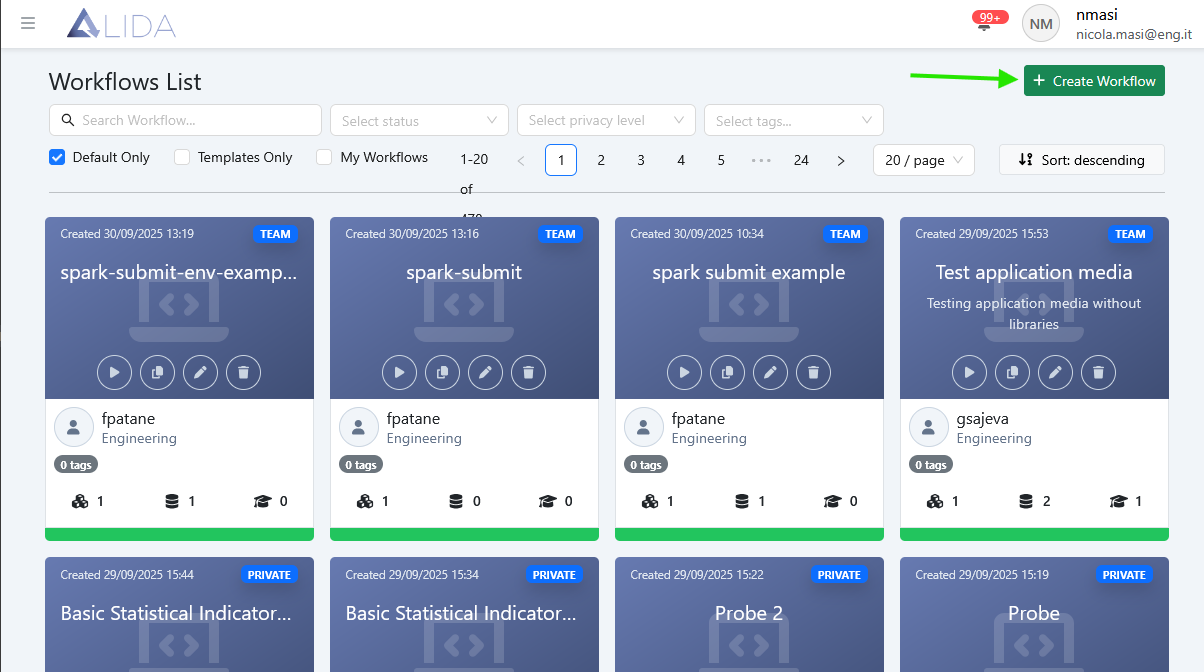
3.1 Access the Workflow Designer
Access the Designer for Workflow creation as shown below:
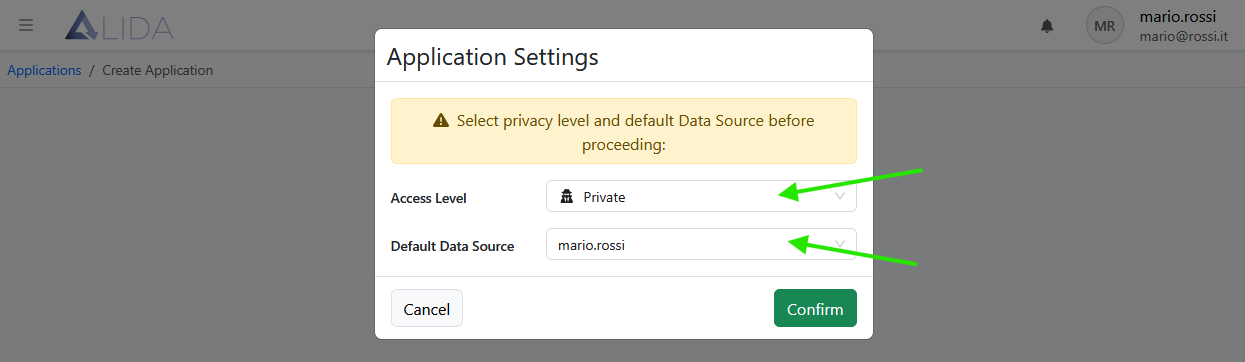
3.2 Configure the Workflow Settings
Fill out the Workflow Settings form as shown:
- Access Level:
Private - Default Data Source:
<your.username>
Then click Confirm.
You have now entered the Workflow Designer, which allows you to combine Datasets, Services, and Models to build your Workflow:
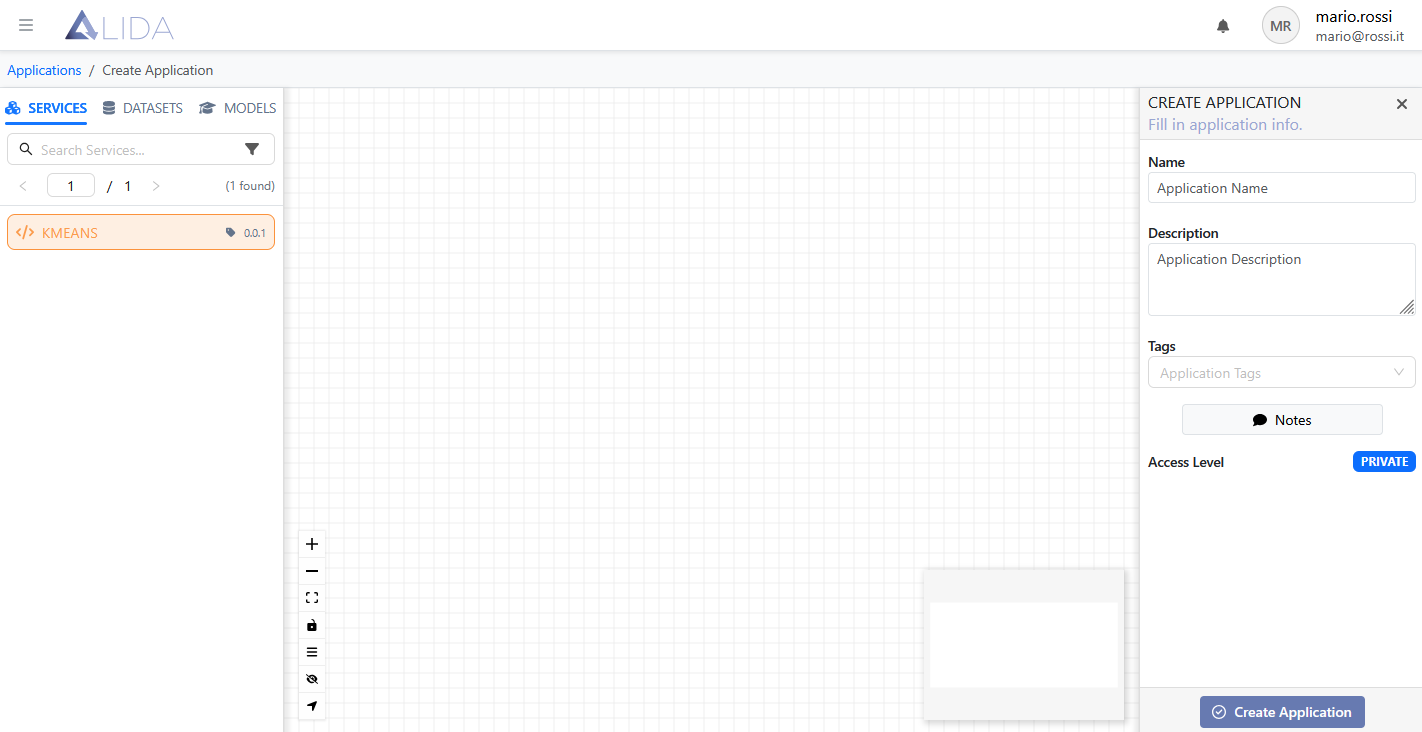
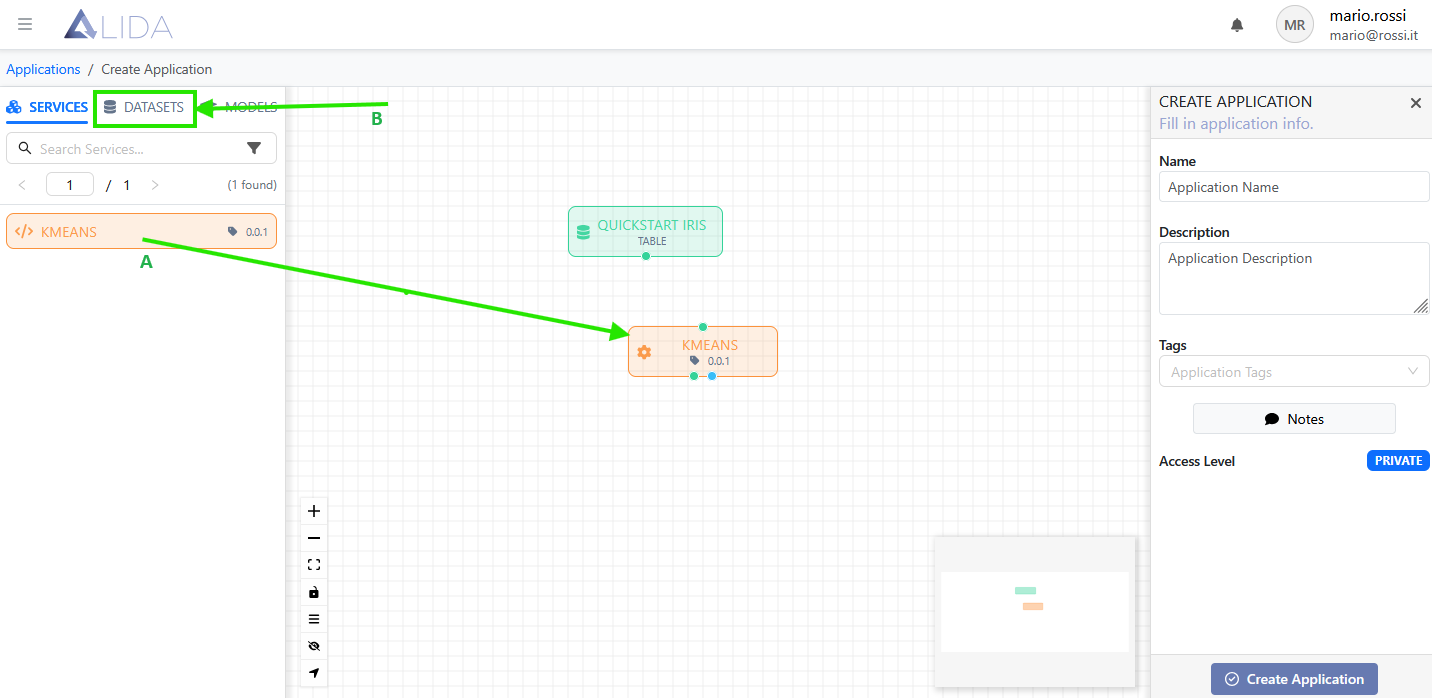
3.4 Assemble the Workflow
Drag and drop the following onto the Designer canvas:
- The KMeans Service
- The Iris Dataset you previously uploaded (under the Datasets tab)
3.5 Connect Components
Connect the “Quickstart Iris” Dataset to the “KMeans” Service by dragging the dataset’s output port (🟢) and dropping it onto the service’s input port (🟢):
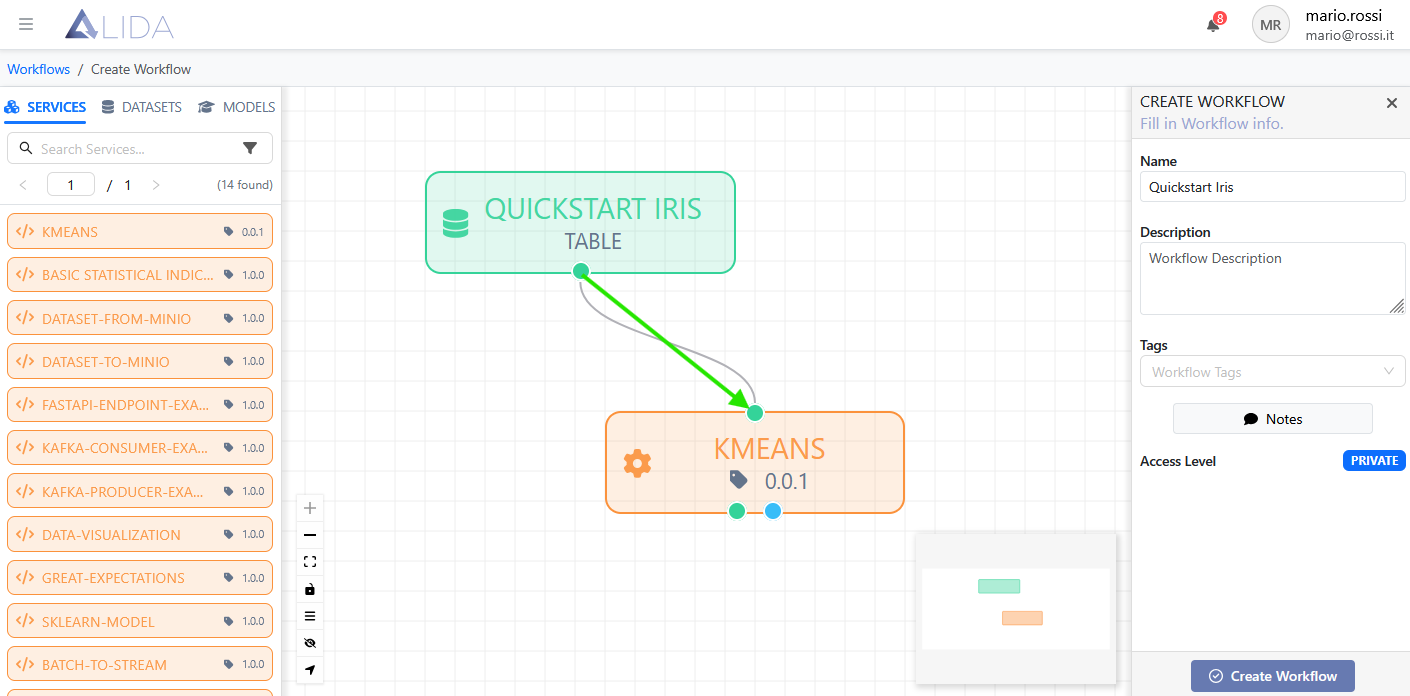
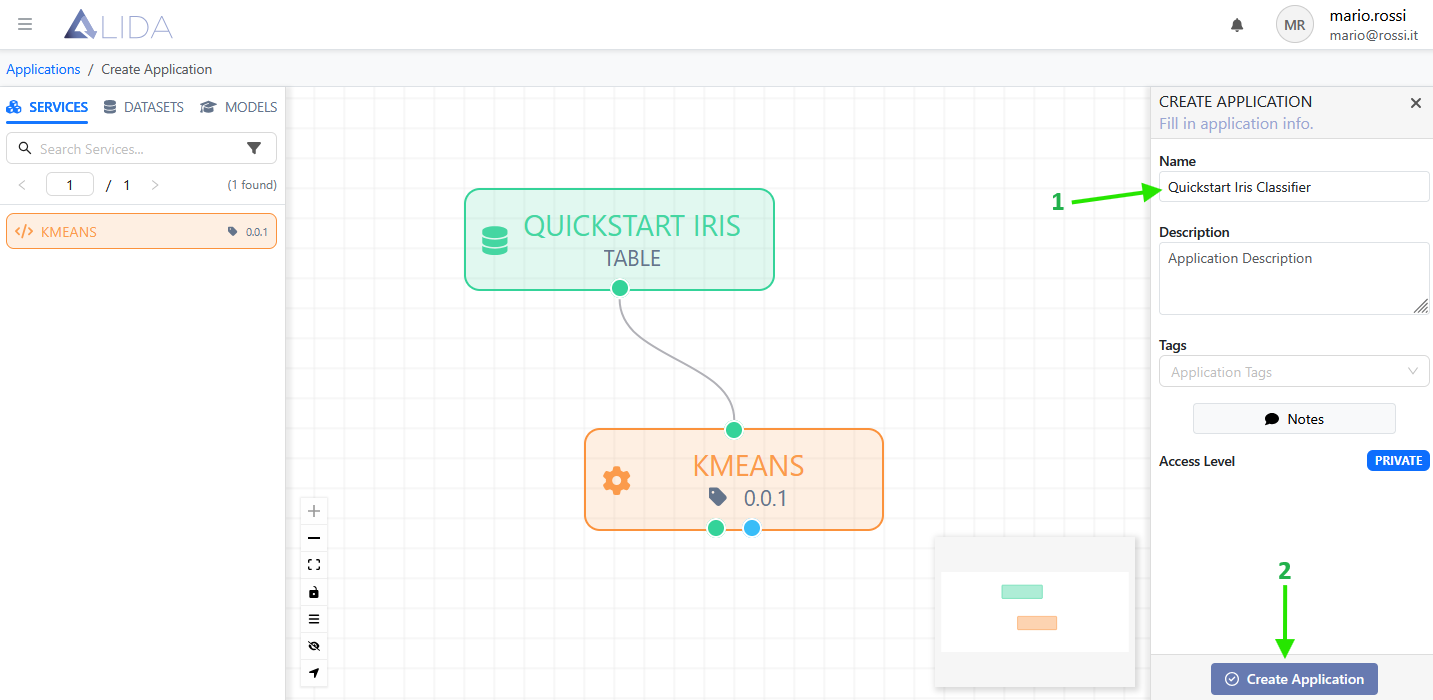
3.6 Assign a Workflow Name
From the right-hand menu, assign a name to your Workflow: Quickstart Iris

3.7 Select the Execution Target
Click on the KMeans Service on the canvas and select the default Target Worker Nodes.
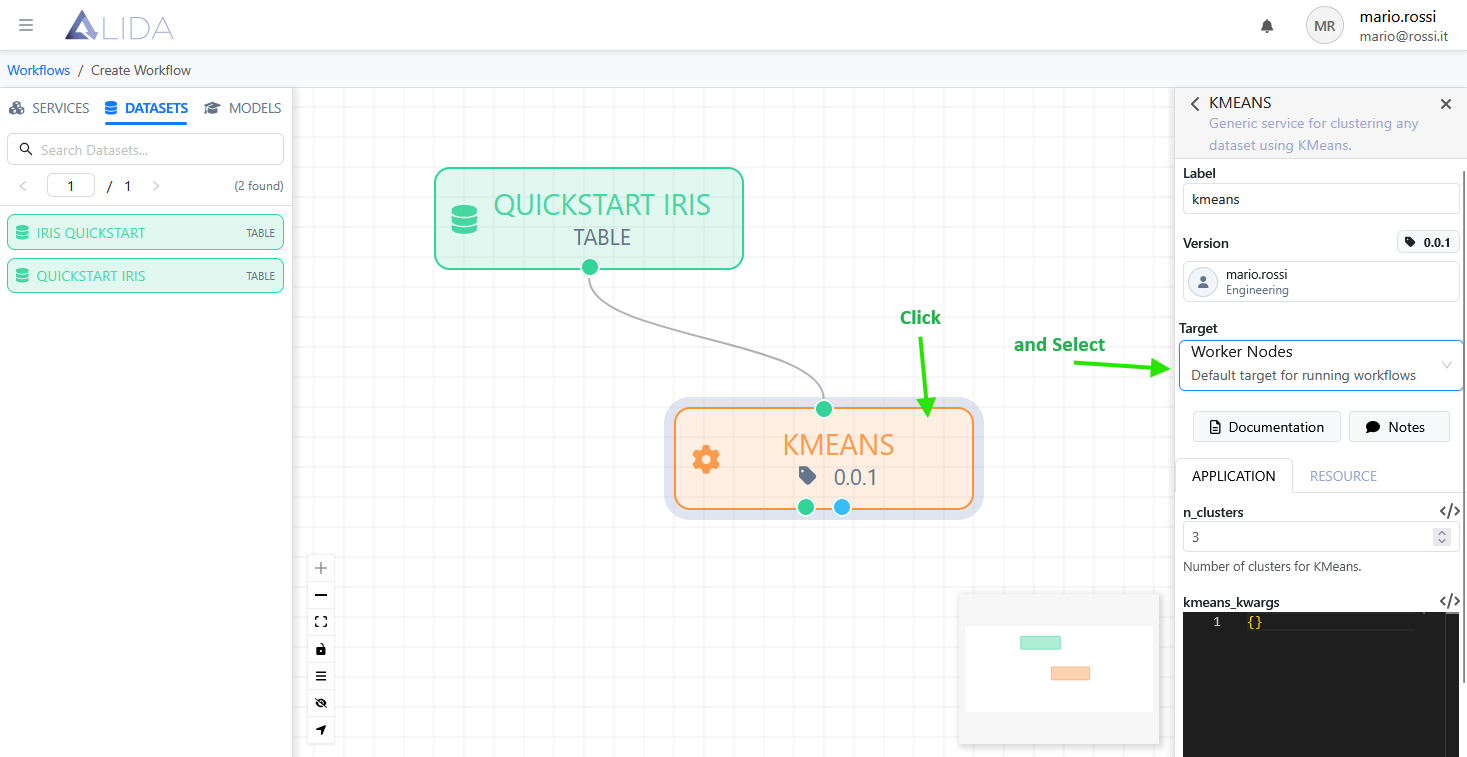
The Target determines the set of cluster nodes eligible to host the execution of the Service.
3.8 Save the Workflow
Click on an empty spot on the canvas and then select Create Workflow.
Note
In this short tutorial, we do not cover the many configuration features available for Workflows and individual Services in Data Analytics System.
For these, please refer to the corresponding sections of this manual.
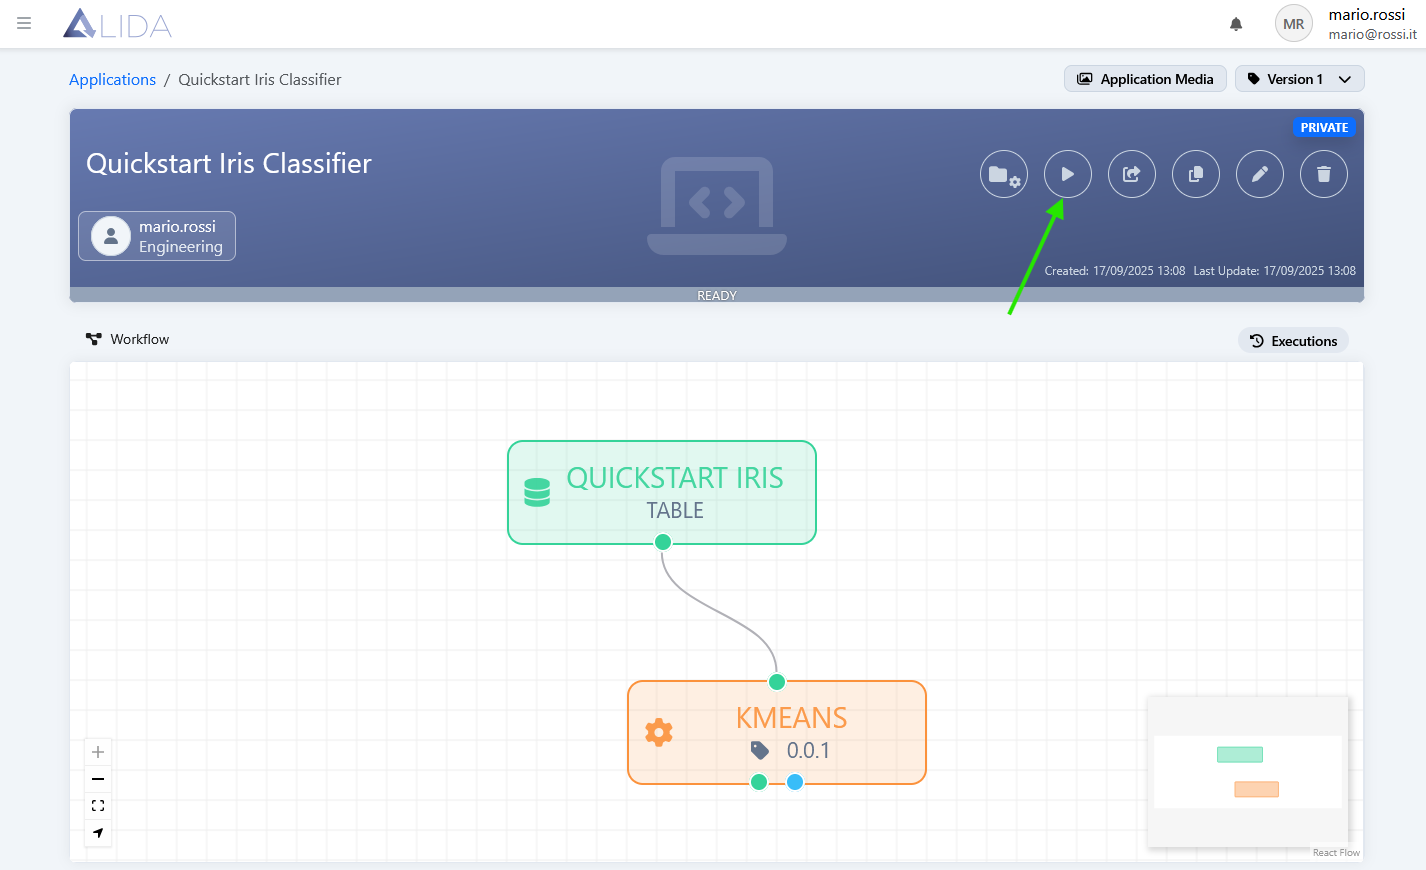
4. Workflow Execution
4.1 Run the Workflow
After creating the Workflow, on its detail page, click Run to execute it.
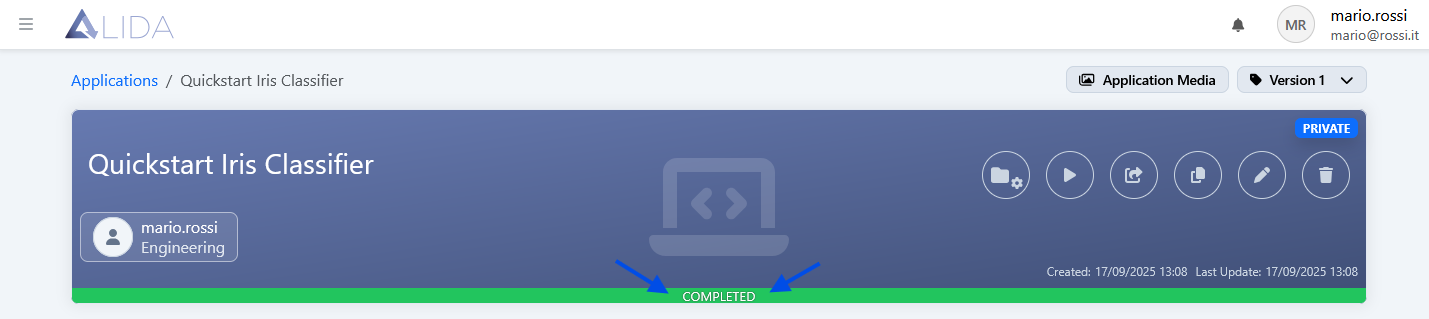
4.2 Execution Status
When execution is complete, the status bar will automatically change to Completed.
5. Viewing the Results
The KMeans Service generates two types of outputs:
- A set of graphical plots
- An output dataset that differs from the input dataset by the addition of a new column containing the classification results
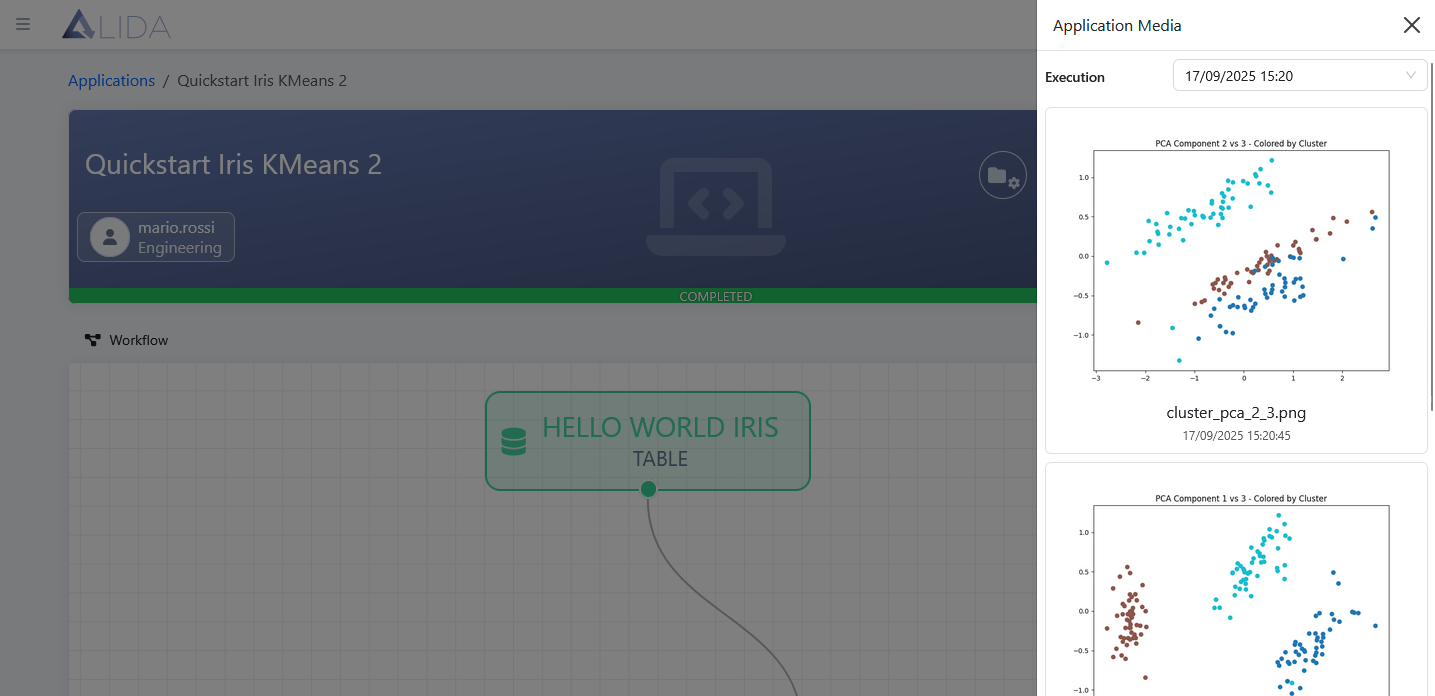
5.1 View the Graphical Results
Remain on the Workflow detail page and click Workflow Media:
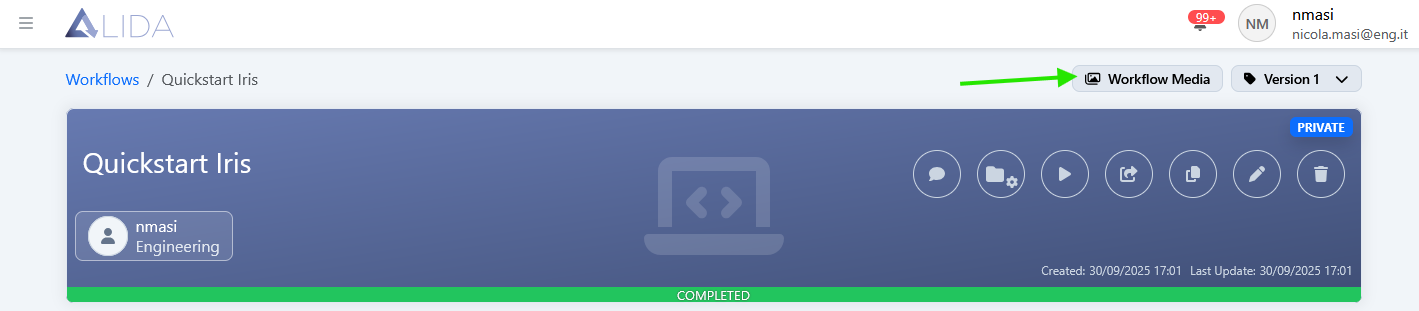
A panel will appear on the right side, showing the plots generated by the Workflow:
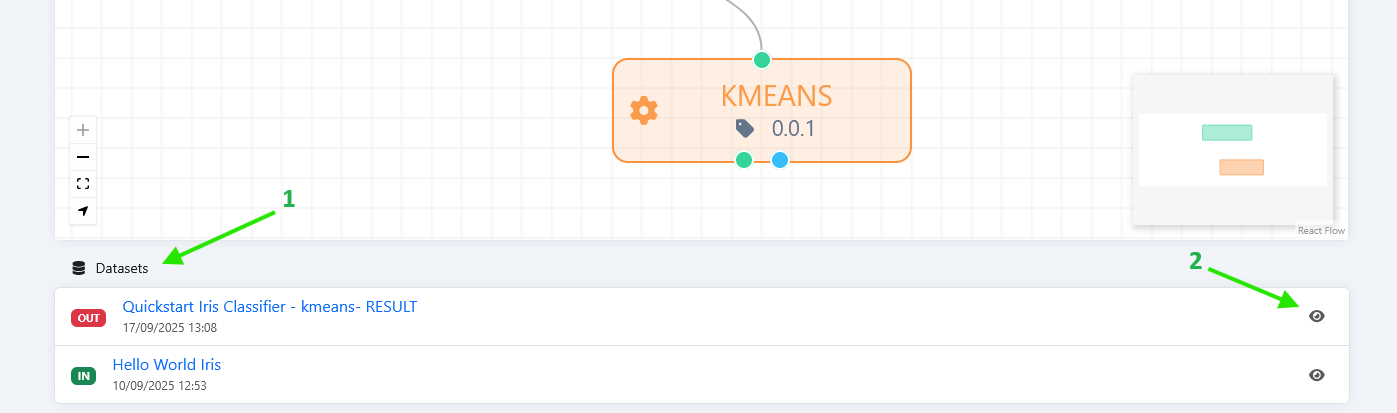
5.2 View the Output Dataset
- Scroll down the current Workflow detail page.
- Open the Datasets section.
- Click the Preview button (
 ) next to the output dataset (
 ).
).
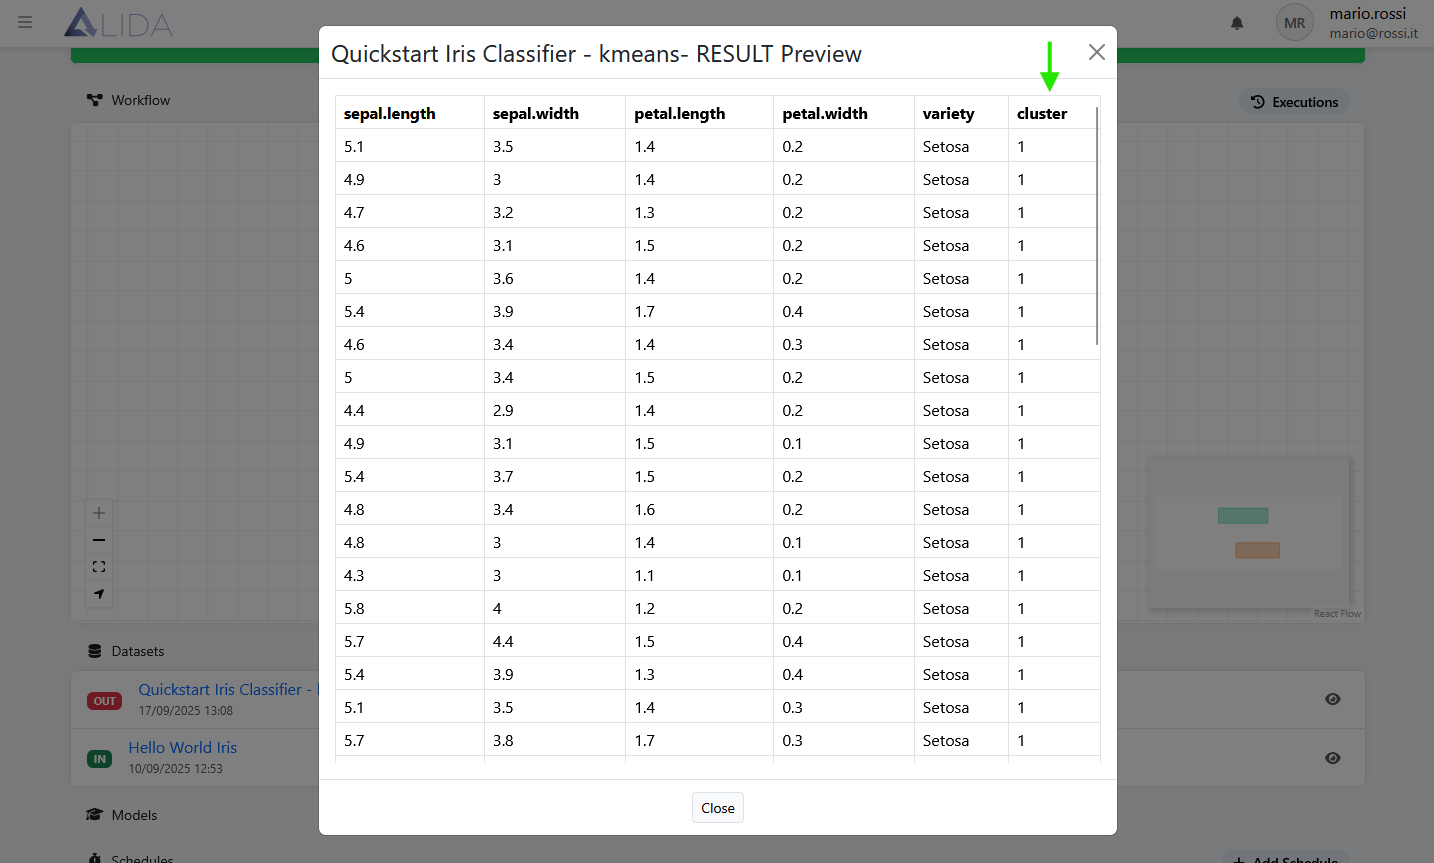
A dialog will appear showing a preview of the resulting dataset.
Note the new cluster column, containing the processing results.
6. Next Steps
Congratulations! You have just created and executed your first Workflow.
Continue exploring Data Analytics System’s concepts and features:
- Visit the The Platform section to explore Data Analytics System graphical interface
- Visit the Assets section to learn more about Data Analytics System’s core components
- Visit the Service section and the tutorial on creating custom Services